Complex content management
Research and policy data for Panteia
A scalable platform for research reports, scenario analysis and trends that support policy and advice.

The question
Researchers built reports by hand: copying figures, remaking charts, and hoping everything still added up. With every new dataset the work started over.
The approach
I designed a platform where data, analyses and texts are linked together. New figures go in once, and all charts and scenarios update themselves.
The result
Reports that are always up to date, and scenarios you can compare side by side in a few clicks. Researchers have time again for what they do best: the story behind the numbers.
What used to take days now takes an afternoon. And we trust the numbers again, because everything comes together in one place.
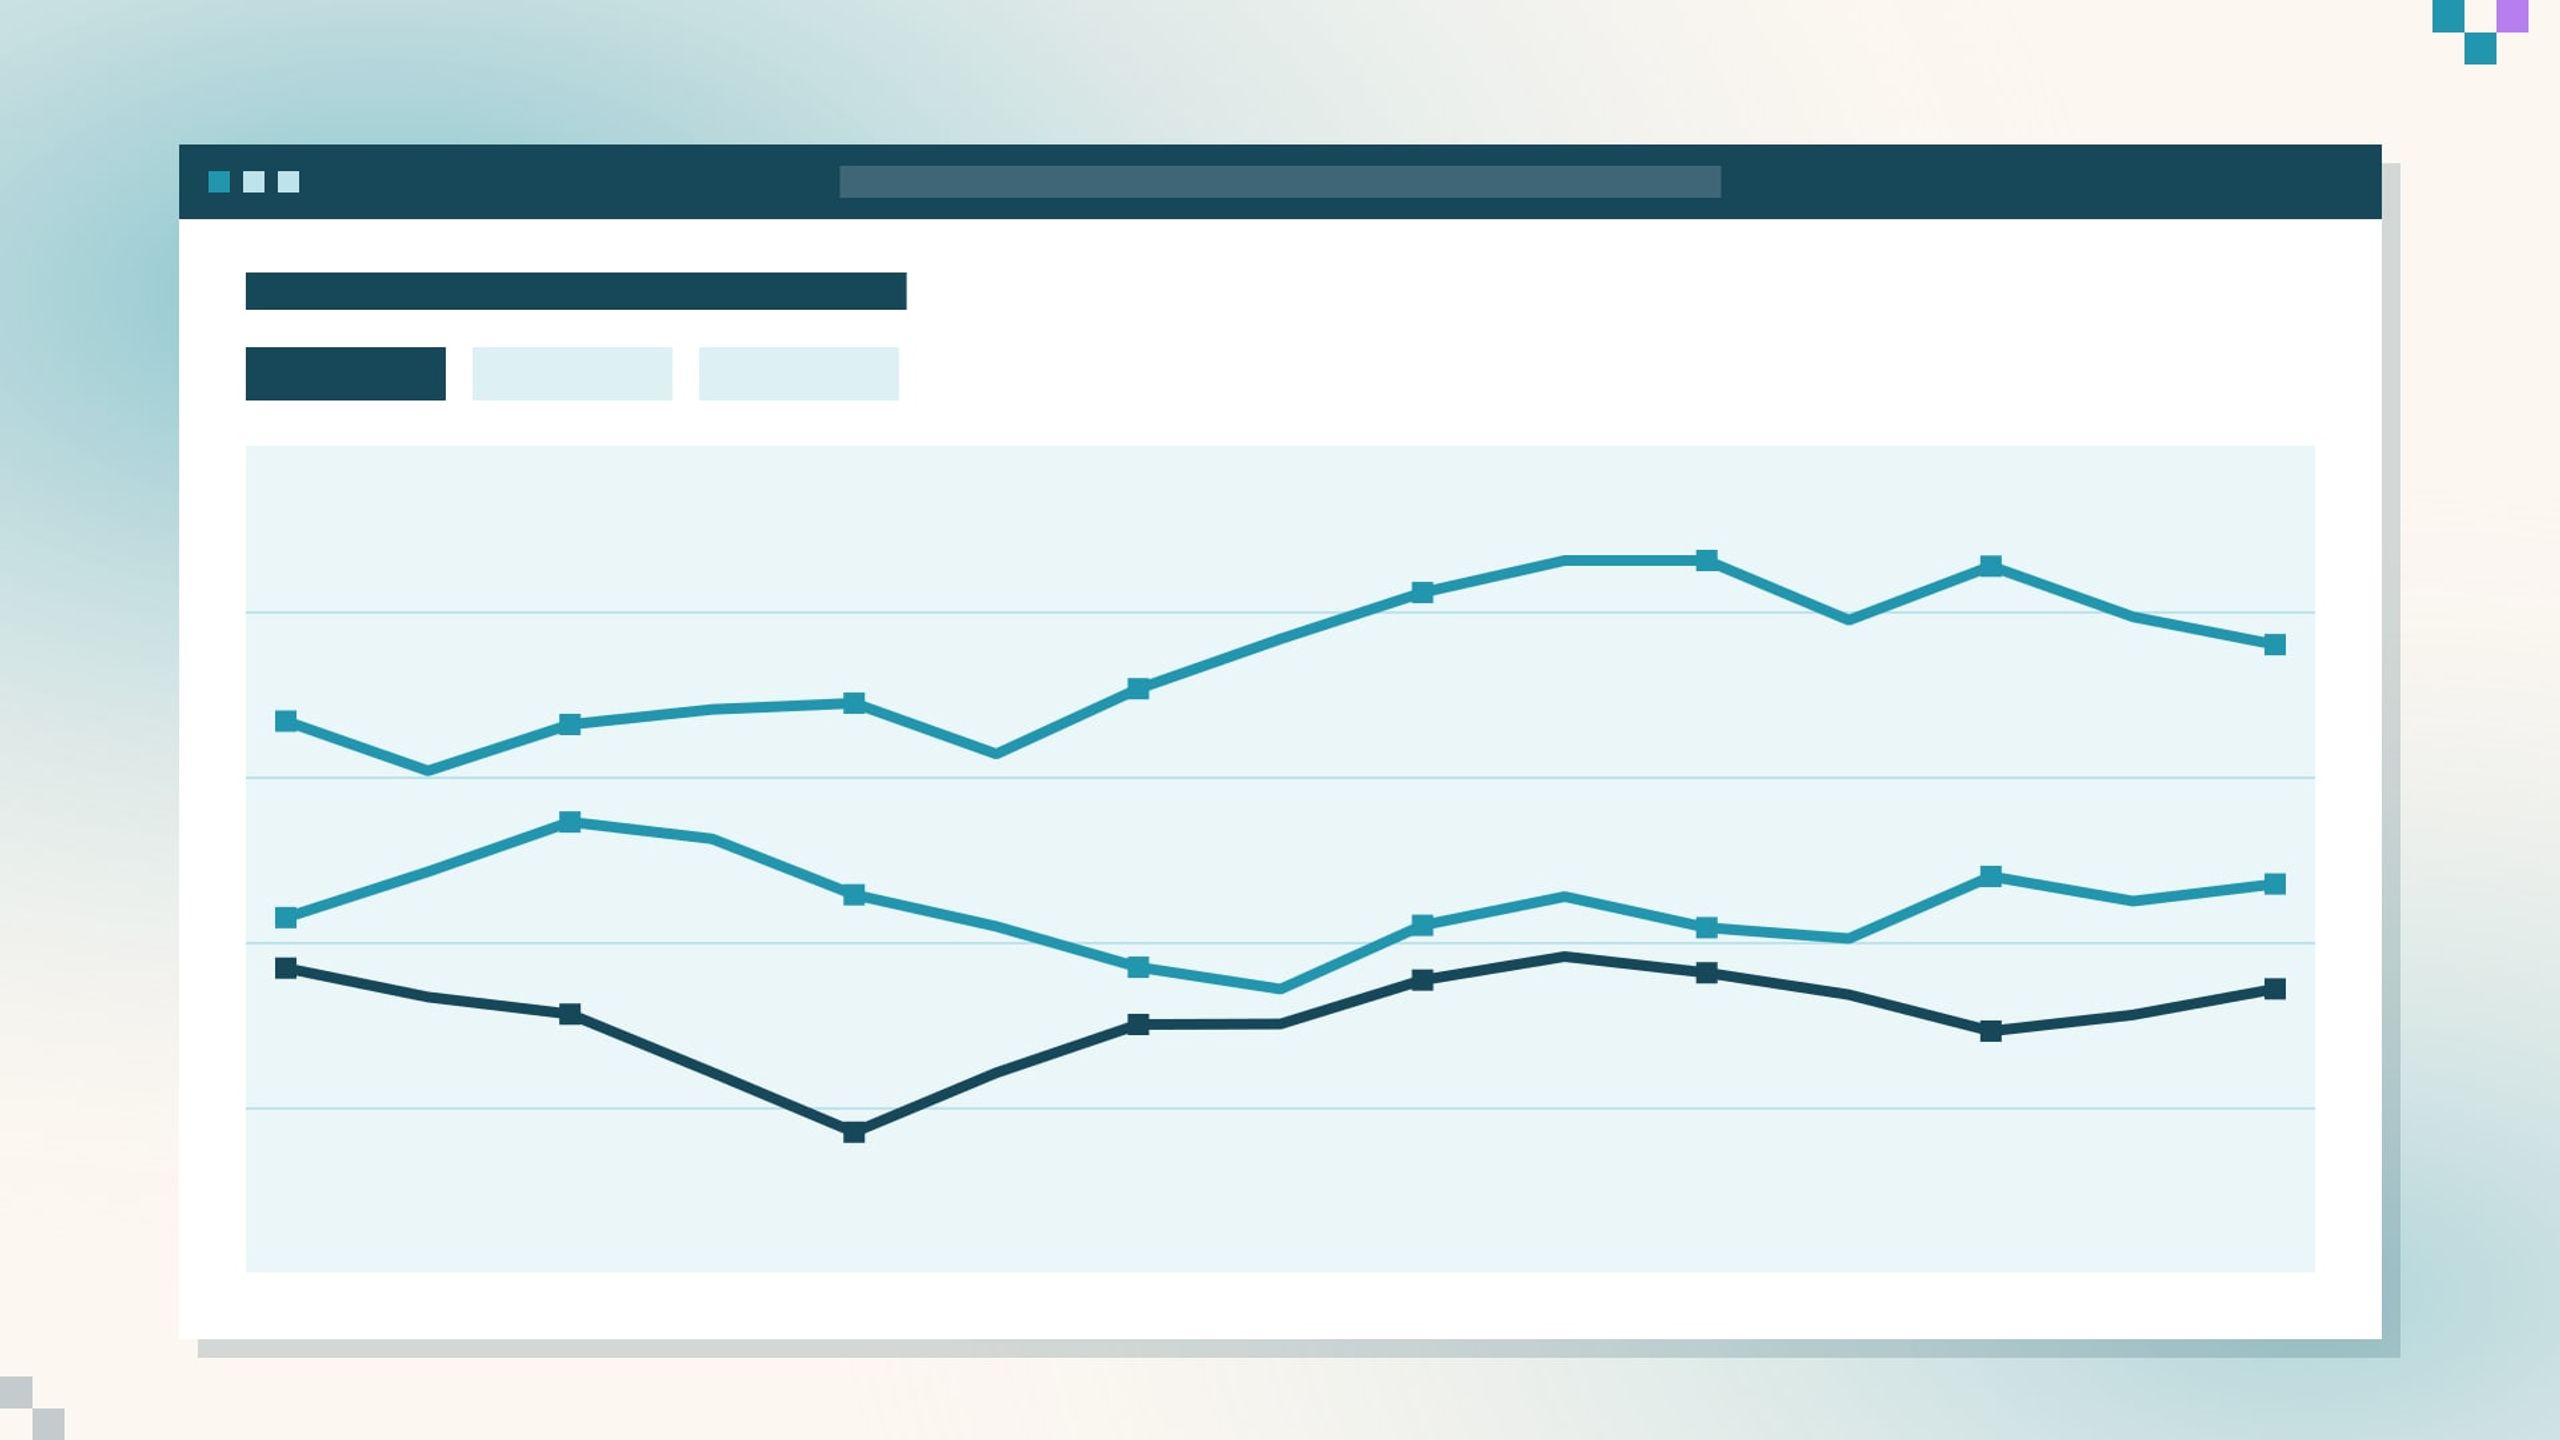
Comparing three scenarios in one chart. 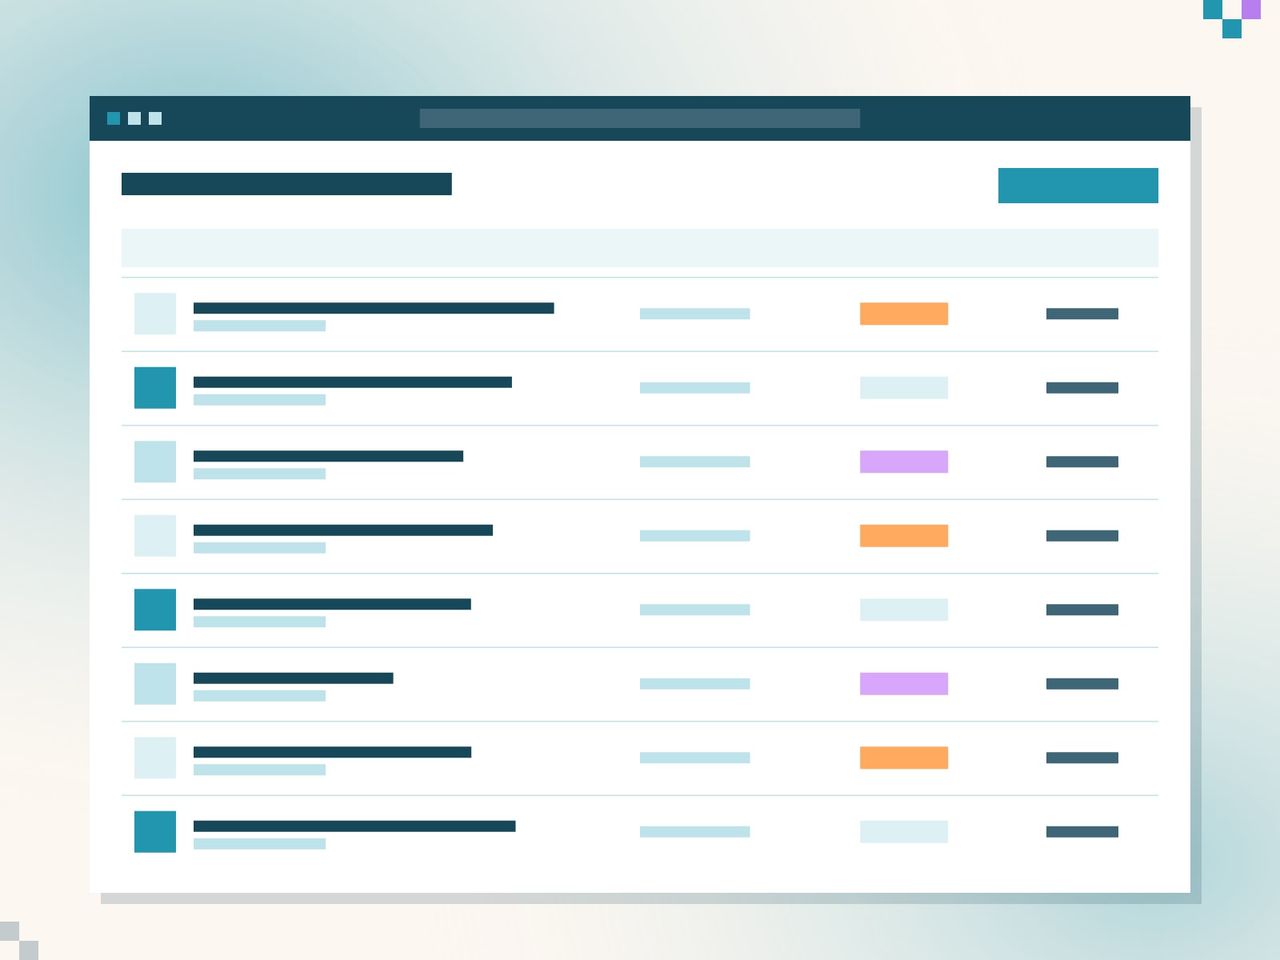
All reports, with what still needs doing. 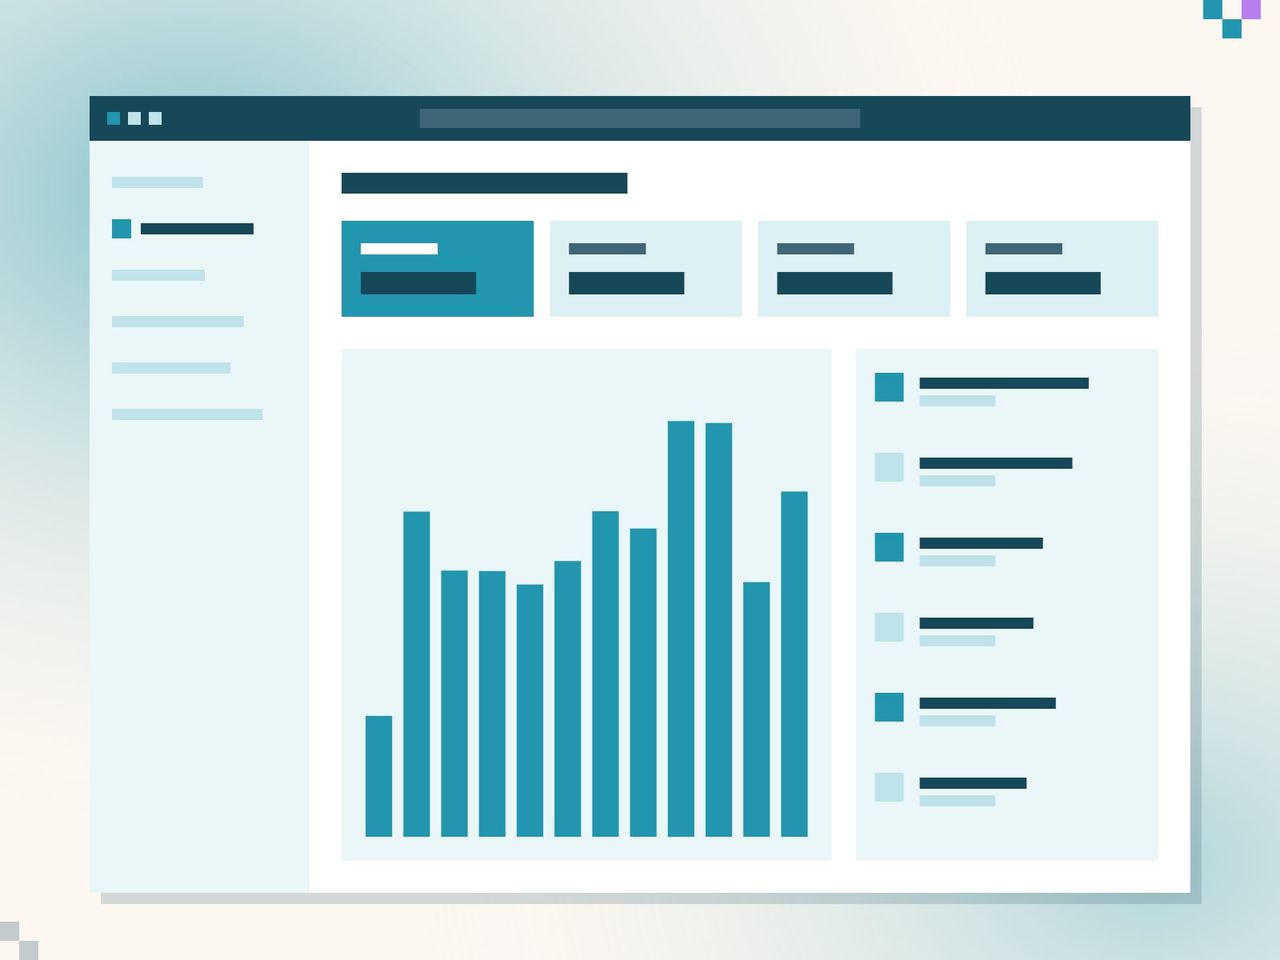
The key trends at a glance.
Your project here too?
Big plans, or just a job that's been lying around for too long. I'd love to hear about it.
Get in touch